Ficheiro:Prime number theorem ratio convergence.svg
Saltar á navegación
Saltar á procura

Tamaño desta vista previa en PNG do ficheiro en formato SVG: 250 × 160 píxeles. Outras resolucións: 320 × 205 píxeles | 640 × 410 píxeles | 1.024 × 655 píxeles | 1.280 × 819 píxeles | 2.560 × 1.638 píxeles.
Ficheiro orixinal (ficheiro SVG; resolución de 250 × 160 píxeles; tamaño do ficheiro: 87 kB)
Resumo
| Descrición |
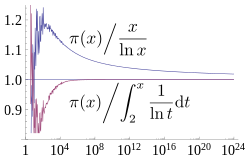
English: A plot showing how two estimates described by the prime number theorem, and converge asymptotically towards , the number of primes less than x. The x axis is and is logarithmic (labelled in evenly spaced powers of 10), going up to 1024, the largest for which is currently known. The former estimate converges extremely slowly, while the latter has visually converged on this plot by 108. Source used to generate this chart is shown below. |
| Data | |
| Orixe | Obra propia |
| Autoría | Dcoetzee |
| SVG desenvolvimento |


Licenza
Eu, como posuidor dos dereitos de autor desta obra, pola presente publícoa baixo a seguinte licenza:
| Este ficheiro está dispoñible baixo a licenza Creative Commons CC0 1.0 de dedicación universal ao dominio público. | |
| A persoa que asociou unha obra con este documento, deu a obra ao dominio público renunciando a todos os seus dereitos sobre ela en todo o mundo baixo as leis de dereitos de autor e relacionadas ou dereitos legais derivados que tiña sobre a obra, na medida permitida pola lei. Pode copiar, modificar, distribuír e empregar esta obra, mesmo para fins comerciais, sen necesidade dun permiso por parte do autor.
|
Source
All source released under CC0 waiver.
Mathematica source to generate graph (which was then saved as SVG from Mathematica):
(* Sample both functions at 600 logarithmically spaced points between \
1 and 2^40 *)
base = N[E^(24 Log[10]/600)];
ratios = Table[{Round[base^x],
    N[PrimePi[Round[base^x]]/(base^x/(x*Log[base]))]}, {x, 1,
    Floor[40/Log[2, base]]}];
ratiosli =
  Table[{Round[base^x],
    N[PrimePi[
       Round[base^x]]/(LogIntegral[base^x] - LogIntegral[2])]}, {x,
    Ceiling[Log[base, 2]], Floor[40/Log[2, base]]}];
(* Supplement with larger known PrimePi values that are too large for \
Mathematica to compute *)
LargePiPrime = {{10^13, 346065536839}, {10^14, 3204941750802}, {10^15,
     29844570422669}, {10^16, 279238341033925}, {10^17,
    2623557157654233}, {10^18, 24739954287740860}, {10^19,
    234057667276344607}, {10^20, 2220819602560918840}, {10^21,
    21127269486018731928}, {10^22, 201467286689315906290}, {10^23,
    1925320391606803968923}, {10^24, 18435599767349200867866}};
ratios2 =
  Join[ratios,
   Map[{#[[1]], N[#[[2]]]/(#[[1]]/(Log[#[[1]]]))} &, LargePiPrime]];
ratiosli2 =
  Join[ratiosli,
   Map[{#[[1]], N[#[[2]]]/(LogIntegral[#[[1]]] - LogIntegral[2])} &,
    LargePiPrime]];
(* Plot with log x axis, together with the horizontal line y=1 *)
Show[LogLinearPlot[1, {x, 1, 10^24}, PlotRange -> {0.8, 1.25}],
 ListLogLinearPlot[{ratios2, ratiosli2}, Joined -> True],
 LabelStyle -> FontSize -> 14]
LaTeX source for labels:
$$ \left.{\pi(x)}\middle/{\frac{x}{\ln x}}\right. $$
$$ \left.{\pi(x)}\middle/{\int_2^x \frac{1}{\ln t} \mathrm{d}t}\right. $$
These were converted to SVG with [1] and then the graph was embedded into the resulting document in Inkscape. Axis fonts were also converted to Liberation Serif in Inkscape.
Historial do ficheiro
Prema nunha data/hora para ver o ficheiro tal e como estaba nese momento.
| Data/Hora | Miniatura | Dimensións | Usuario | Comentario | |
|---|---|---|---|---|---|
| actual | 21 de marzo de 2013 ás 14:07 | | 250 × 160 (87 kB) | wikimediacommons>Dcoetzee | Change n to x to match article |
Uso do ficheiro
A seguinte páxina usa este ficheiro: