Ficheiro:TV pic3.png
Saltar á navegación
Saltar á procura
Tamaño desta vista previa: 732 × 600 píxeles. Outras resolucións: 293 × 240 píxeles | 586 × 480 píxeles | 786 × 644 píxeles.
Ficheiro orixinal (786 × 644 píxeles; tamaño do ficheiro: 11 kB; tipo MIME: image/png)
Resumo
| Descrición |
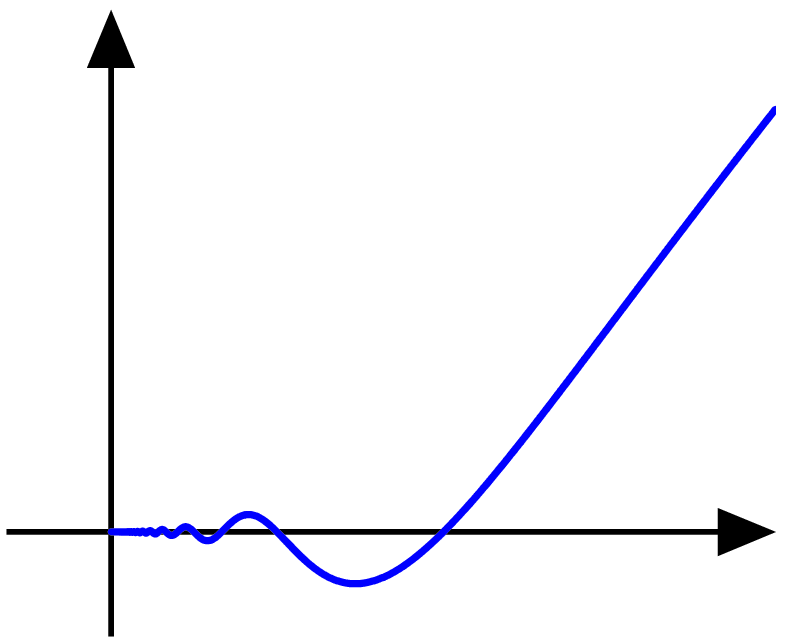
English: The function f(x)=x2 sin(1/x) for x>0.
日本語: f2 は原点で微分可能.
Nederlands: De functie f(x)=x2 sin(1/x) voor x>0.
Português: A função f(x)=x2 sin(1/x) para x>0.
Svenska: Funktionen f(x)=x2 sin(1/x), för x>0. |
|||
| Data | ||||
| Orixe | Obra propia | |||
| Autoría | Oleg Alexandrov | |||
| Outras versións |
|
|||
| PNG desenvolvimento |

.svg)
Licenza
| Eu, como posuidor dos dereitos de autor desta obra, libéroa para que pertenza ao dominio público. Isto é válido en todo o mundo. Nalgúns países, isto pode non ser legalmente posible; entón: Concedo a calquera o dereito de empregar esta obra para o propósito que considere oportuno, sen condicións, agás aquelas que sexan requiridas pola lei. |
Source code (MATLAB)
function discontinuity()

   % set up the plotting window
   thick_line=2.5; thin_line=2; arrow_size=3; arrow_type=2;
   fs=30; circrad=0.06;


   a=0; b=2/pi; h=0.0001; x0=1;
   X=a:h:b;
   f=inline('X.^2');
   Y=f(X).*sin(1./(X+eps));


   figure(3); clf; hold on; axis equal; axis off;

   Q=-0.1; R=2/pi;
   arrow([Q 0], [R, 0], thin_line, arrow_size, pi/8,arrow_type, [0, 0, 0]) % xaxis
   arrow([0 Q], [0, 0.5], thin_line, arrow_size, pi/8,arrow_type, [0, 0, 0]); % y axis


   plot(X, Y, 'linewidth', thick_line);

   axis ([-0.2, R, -0.3, R]);
   saveas(gcf, 'TV_pic3.eps', 'psc2');


function arrow(start, stop, thickness, arrowsize, sharpness, arrow_type, color)


%  draw a line with an arrow at the end
%  start is the x,y point where the line starts
%  stop is the x,y point where the line stops
%  thickness is an optional parameter giving the thickness of the lines
%  arrowsize is an optional argument that will give the size of the arrow
%  It is assumed that the axis limits are already set
%  0 < sharpness < pi/4 determines how sharp to make the arrow
%  arrow_type draws the arrow in different styles. Values are 0, 1, 2, 3.

%       8/4/93    Jeffery Faneuff
%       Copyright (c) 1988-93 by the MathWorks, Inc.
%       Modified by Oleg Alexandrov 2/16/03


   if nargin <=6
      color=[0, 0, 0];
   end

   if (nargin <=5)
      arrow_type=0;   % the default arrow, it looks like this: ->
   end

   if (nargin <=4)
      sharpness=pi/4; % the arrow sharpness - default = pi/4
   end

   if nargin<=3
      xl = get(gca,'xlim');
      yl = get(gca,'ylim');
      xd = xl(2)-xl(1);
      yd = yl(2)-yl(1);
      arrowsize = (xd + yd) / 2;   % this sets the default arrow size
   end

   if (nargin<=2)
      thickness=0.5; % default thickness
   end


   xdif = stop(1) - start(1);
   ydif = stop(2) - start(2);

   if (xdif == 0)
      if (ydif >0)
         theta=pi/2;
      else
         theta=-pi/2;
      end
   else
      theta = atan(ydif/xdif);  % the angle has to point according to the slope
   end

   if(xdif>=0)
      arrowsize = -arrowsize;
   end

   if (arrow_type == 0) % draw the arrow like two sticks originating from its vertex
      xx = [start(1), stop(1),(stop(1)+0.02*arrowsize*cos(theta+sharpness)),NaN,stop(1),...
            (stop(1)+0.02*arrowsize*cos(theta-sharpness))];
      yy = [start(2), stop(2), (stop(2)+0.02*arrowsize*sin(theta+sharpness)),NaN,stop(2),...
            (stop(2)+0.02*arrowsize*sin(theta-sharpness))];
      plot(xx,yy, 'LineWidth', thickness, 'color', color)
   end

   if (arrow_type == 1)  % draw the arrow like an empty triangle
      xx = [stop(1),(stop(1)+0.02*arrowsize*cos(theta+sharpness)), ...
            stop(1)+0.02*arrowsize*cos(theta-sharpness)];
      xx=[xx xx(1) xx(2)];

      yy = [stop(2),(stop(2)+0.02*arrowsize*sin(theta+sharpness)), ...
            stop(2)+0.02*arrowsize*sin(theta-sharpness)];
      yy=[yy yy(1) yy(2)];

      plot(xx,yy, 'LineWidth', thickness, 'color', color)

%     plot the arrow stick
      plot([start(1) stop(1)+0.02*arrowsize*cos(theta)*cos(sharpness)], [start(2), stop(2)+ ...
                    0.02*arrowsize*sin(theta)*cos(sharpness)], 'LineWidth', thickness, 'color', color)

   end

   if (arrow_type==2) % draw the arrow like a full triangle
      xx = [stop(1),(stop(1)+0.02*arrowsize*cos(theta+sharpness)), ...
            stop(1)+0.02*arrowsize*cos(theta-sharpness),stop(1)];

      yy = [stop(2),(stop(2)+0.02*arrowsize*sin(theta+sharpness)), ...
            stop(2)+0.02*arrowsize*sin(theta-sharpness),stop(2)];
      H=fill(xx, yy, color);% fill with black
      set(H, 'EdgeColor', 'none')

%     plot the arrow stick
      plot([start(1) stop(1)+0.01*arrowsize*cos(theta)], [start(2), stop(2)+ ...
                    0.01*arrowsize*sin(theta)], 'LineWidth', thickness, 'color', color)
   end

   if (arrow_type==3) % draw the arrow like a filled 'curvilinear' triangle
      curvature=0.5; % change here to make the curved part more curved (or less curved)
      radius=0.02*arrowsize*max(curvature, tan(sharpness));
      x1=stop(1)+0.02*arrowsize*cos(theta+sharpness);
      y1=stop(2)+0.02*arrowsize*sin(theta+sharpness);
      x2=stop(1)+0.02*arrowsize*cos(theta)*cos(sharpness);
      y2=stop(2)+0.02*arrowsize*sin(theta)*cos(sharpness);
      d1=sqrt((x1-x2)^2+(y1-y2)^2);
      d2=sqrt(radius^2-d1^2);
      d3=sqrt((stop(1)-x2)^2+(stop(2)-y2)^2);
      center(1)=stop(1)+(d2+d3)*cos(theta);
      center(2)=stop(2)+(d2+d3)*sin(theta);

      alpha=atan(d1/d2);
      Alpha=-alpha:0.05:alpha;
      xx=center(1)-radius*cos(Alpha+theta);
      yy=center(2)-radius*sin(Alpha+theta);
      xx=[xx stop(1) xx(1)];
      yy=[yy stop(2) yy(1)];

      H=fill(xx, yy, color);% fill with black
      set(H, 'EdgeColor', 'none')

%     plot the arrow stick
      plot([start(1) center(1)-radius*cos(theta)], [start(2), center(2)- ...
                    radius*sin(theta)], 'LineWidth', thickness, 'color', color);
   end
Historial do ficheiro
Prema nunha data/hora para ver o ficheiro tal e como estaba nese momento.
| Data/Hora | Miniatura | Dimensións | Usuario | Comentario | |
|---|---|---|---|---|---|
| actual | 25 de febreiro de 2007 ás 07:28 | | 786 × 644 (11 kB) | wikimediacommons>Oleg Alexandrov |
Uso do ficheiro
Non hai páxinas que usen este ficheiro.