Ficheiro:Gaussian 2d surface.png
Saltar á navegación
Saltar á procura
Tamaño desta vista previa: 800 × 422 píxeles. Outras resolucións: 320 × 169 píxeles | 640 × 338 píxeles | 1.024 × 540 píxeles | 1.923 × 1.015 píxeles.
Ficheiro orixinal (1.923 × 1.015 píxeles; tamaño do ficheiro: 215 kB; tipo MIME: image/png)
Resumo
| Descrición |
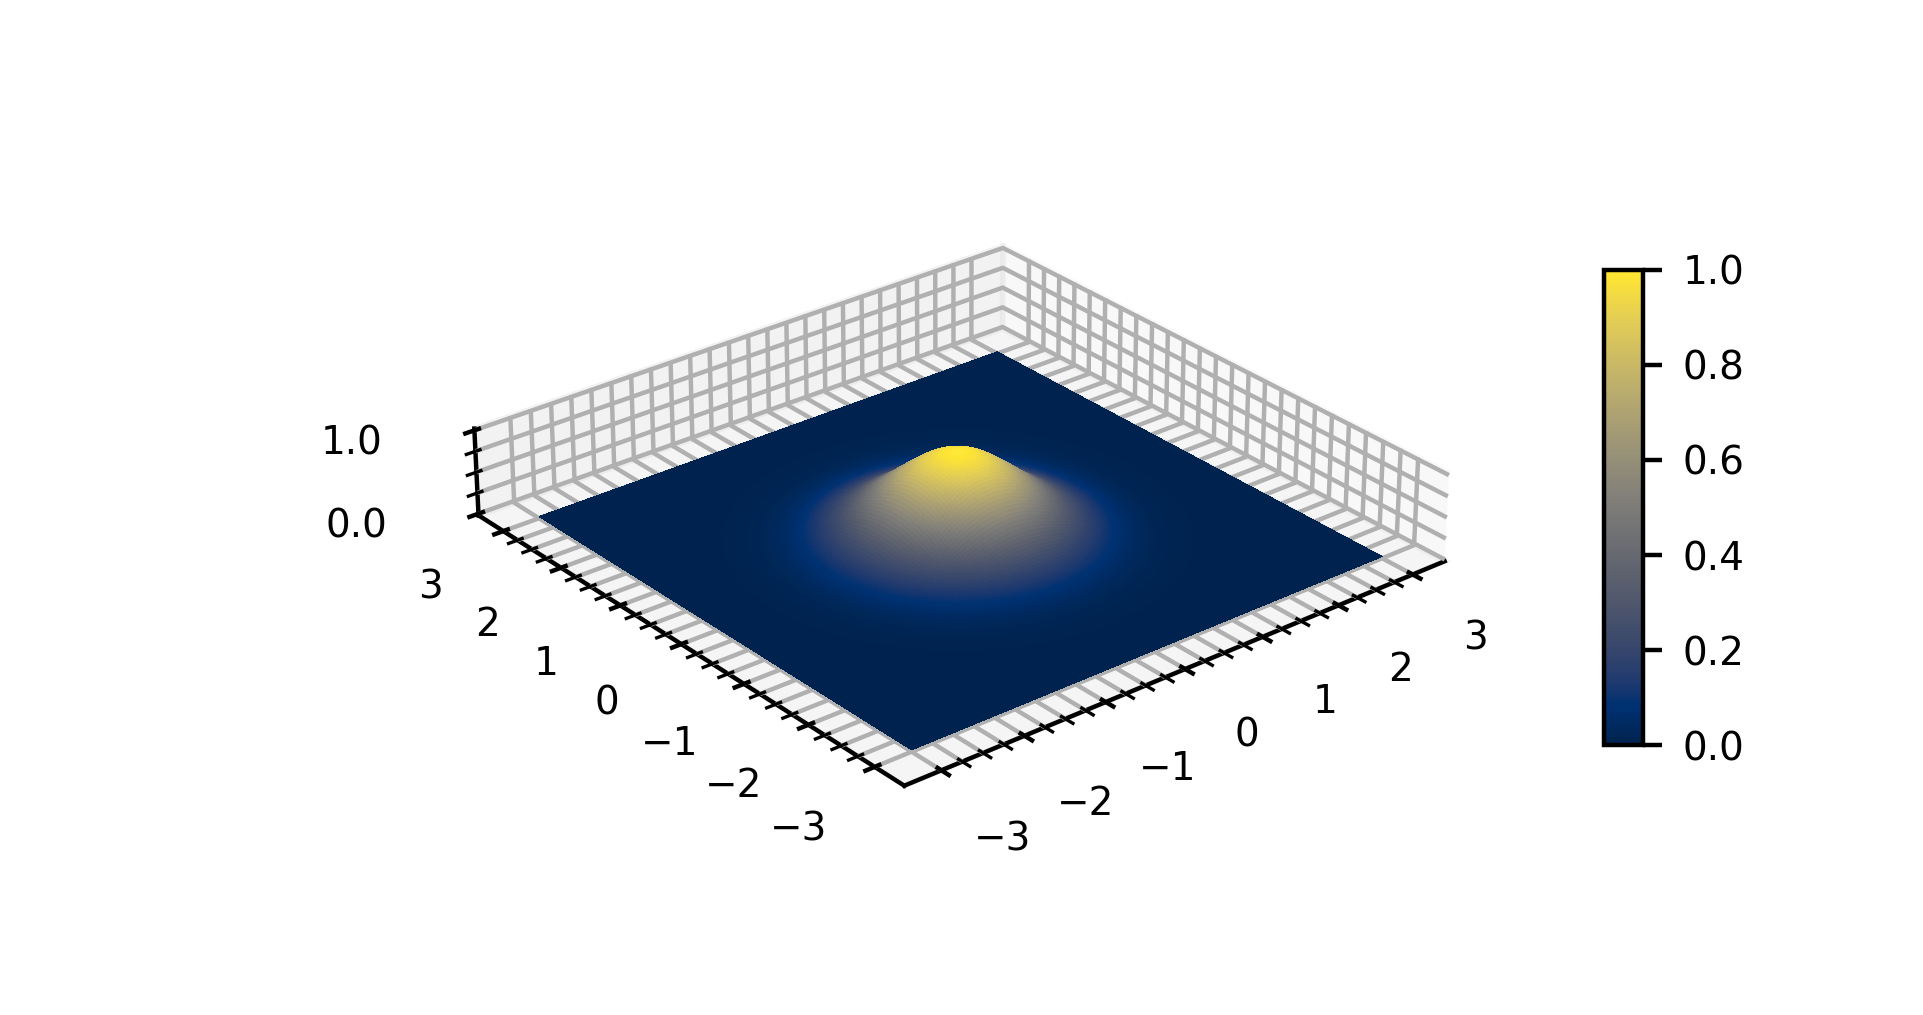
English: Created in Python with Numpy and Matplotlib. |
| Data | |
| Orixe | Obra propia |
| Autoría | Kopak999 |
| PNG desenvolvimento | |
| Código fonte | Python codeimport numpy as np
import matplotlib as mpl
import matplotlib.pyplot as plt
from matplotlib import cm
exp = np.exp
def Gaussian2D(X, Y, a=1,):
"""
This function takes meshgrids of X- and Y-values and outputs an array of
Z-values in the shape of the Gaussian distribution:
exp(-a(X^2 + Y^2)).
"""
return exp(-a*(X**2 + Y**2))
def plotGaussianSurface(
X, Y, Z,
colormap=cm.cividis,
title="",
filetype="png",
saveflag=False,
resolution=200,
dpi=300,
numticks_xy=7,
numticks_z=2,
numticks_xy_minor=25,
numticks_z_minor=5,
):
"""
Plots a 3D-surface of a 2D-Gaussian function.
X, Y: Meshgrids of x- and y-values for the Gaussian.
Z: The output of the Gaussian function.
colormap: The colormap for the surface, mapped to the Z-values of the
graph.
title: Title of the graph.
filetype: Three-letter extension of the image filetype for saving the
graph. Default is png.
saveflag: Boolean flag to check if the graph should be saved to a file.
Set to True if you want to save the graph to a file. Default is False.
resolution: Number of pixels to render along the x- and y-axes.
Default is 200, which gives a 200x200 grid.
dpi: Dots-per-inch of the image. Default is 300.
"""
plt.ioff()
# Set up kwargs:
limit = int(np.ceil(np.amax(X)))
zmin = int(np.floor(np.amin(Z)))
zmax = int(np.ceil(np.amax(Z)))
norm = mpl.colors.Normalize(vmin=zmin, vmax=zmax)
aspect = (limit*2 + 1, limit*2 + 1, zmax)
xy_major_params = dict(
direction = "in",
)
xy_minor_params = dict(
direction = "in",
which = "minor",
)
xy_major_ticks = dict(
ticks = np.linspace(-limit, limit, numticks_xy, endpoint=True,),
)
xy_minor_ticks = dict(
ticks = np.linspace(-limit, limit, numticks_xy_minor, endpoint=True,),
minor = True,
)
z_major_params = dict(
which = "major",
labelbottom = True,
labeltop = False,
)
z_minor_params = dict(
which = "minor",
)
z_major_ticks = dict(
ticks = np.linspace(0, zmax, numticks_z, endpoint=True,),
)
z_minor_ticks = dict(
ticks = np.linspace(0, zmax, numticks_z_minor, endpoint=True,),
minor = True,
)
tick_labelsize = 7
fig = plt.figure(dpi=dpi)
ax = fig.add_subplot(1, 1, 1, projection ='3d')
# Plot the surface
surf = ax.plot_surface(
X, Y, Z,
cmap = colormap,
linewidth=0,
antialiased=False,
vmin = zmin, vmax = zmax,
rcount = resolution,
ccount = resolution,
norm = norm,
)
# Customize the z axis.
ax.set_zlim(zmin, zmax)
# ax.zaxis.set_major_locator(LinearLocator(10))
ax.zaxis.set_major_formatter('{x:.1f}')
ax.set_title(
title,
fontdict = dict(verticalalignment = "bottom"),
)
ax.set_box_aspect(aspect)
# ax.proj_type("ortho")
ax.set_facecolor('none')
# Set tick parameters
ax.xaxis.set_tick_params(**xy_major_params)
ax.xaxis.set_tick_params(**xy_minor_params)
ax.yaxis.set_tick_params(**xy_major_params)
ax.yaxis.set_tick_params(**xy_minor_params)
ax.zaxis.set_tick_params(**z_major_params)
ax.zaxis.set_tick_params(**z_minor_params)
ax.set_xticks(**xy_major_ticks)
ax.set_xticks(**xy_minor_ticks)
ax.set_yticks(**xy_major_ticks)
ax.set_yticks(**xy_minor_ticks)
ax.set_zticks(**z_major_ticks)
ax.set_zticks(**z_minor_ticks)
ax.tick_params(labelsize=tick_labelsize)
cbar = fig.colorbar(
surf,
ax=ax,
orientation='vertical',
shrink=0.5,
aspect=12,
pad = 0.10,
)
cbar.ax.tick_params(labelsize=tick_labelsize)
if saveflag:
savePlot(colormap, filetype)
plt.tight_layout()
plt.show()
x = y = np.linspace(-3, 3, 2**10, endpoint=True)
X, Y = np.meshgrid(x, y)
plotargs = dict(
saveflag = False,
dpi = 400,
resolution = 200,
numticks_xy=7,
numticks_xy_minor=25,
numticks_z=2,
numticks_z_minor=5,
)
plotGaussianSurface(X, Y, Gaussian2D(X, Y), **plotargs,)
|
Licenza
Eu, como posuidor dos dereitos de autor desta obra, pola presente publícoa baixo a seguinte licenza:
Este ficheiro está licenciado baixo a licenza Creative Commons recoñecemento compartir igual 4.0 internacional.
- Vostede é libre de:
- compartir – copiar, distribuír e difundir a obra
- facer obras derivadas – adaptar a obra
- Baixo as seguintes condicións:
- recoñecemento – Debe indicar a debida atribución de autoría, fornecer unha ligazón á licenza e indicar se se realizaron cambios. Pode facer isto de calquera forma razoable, mais non nunha forma que indique que quen posúe a licenza apoia ou subscribe o seu uso da obra.
- compartir igual – Se altera, transforma ou amplía este contido, debe publicar as súas contribucións baixo a mesma licenza ou outra compatible á orixinal.
Historial do ficheiro
Prema nunha data/hora para ver o ficheiro tal e como estaba nese momento.
| Data/Hora | Miniatura | Dimensións | Usuario | Comentario | |
|---|---|---|---|---|---|
| actual | 17 de decembro de 2020 ás 02:30 | | 1.923 × 1.015 (215 kB) | wikimediacommons>Kopak999 | Uploaded own work with UploadWizard |
Uso do ficheiro
A seguinte páxina usa este ficheiro: